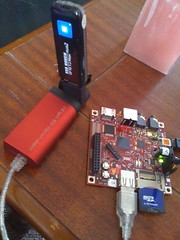
I broke my old Prolink Modem by walking around while it was plugged in and twisting the USB plug. I got a newer 7.2MB capable modem from Deal Extreme. Plugged into the beagleboard it shows up as a CD as expected and I ejected it to get the ttyUSBx devices. Unfortunately on the first try none of them wanted to respond to AT commands, it only started working after I installed the driver on windows and connected it up. A throughput test shows that it is working slightly better than the 3.6Mb/s Prolink promises.
Usual diagonistics on Linux shows:
lsusb - 05c6:0015 Qualcomm, Inc.
ATQ command works and dialing proceeds then I get stuck in an Unsolicited Message Block ("+ZUSIMR:2") using the ModemManager/NetworkManager Combo.
ATI gives:
Manufacturer: BMC INCORPORATED
Model: HD360
Revision: W1MV1.0.0B20100128 W1MV1.0.0B20100128 1 [Sep 4 2008 12:00:00]
IMEI:
+GCAP: +CGSM,+DS,+ES
Not much but at least a start for digging.
Wednesday, September 29, 2010
Tuesday, September 28, 2010
Fusing channel - array of cheap camera
I decided to do another experiment with my multitude of USB webcams and Gstreamer. This time I am capturing 2 shots using the stereo config I used before, but with an InfraRed filter with 850nm as the pass-band over one of the cameras. The rig looks nothing spectacular but costs only $40 net.
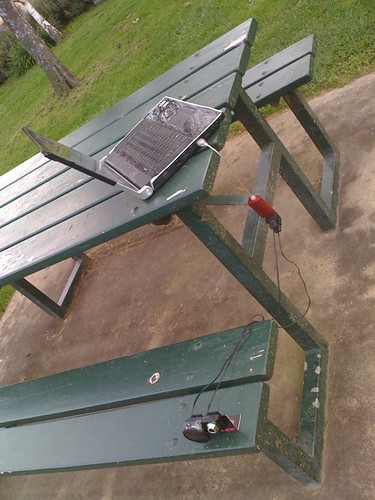
There is some parallax and neither the camera nor the mount is calibrated. Registration of the multi-band images is purely by trial and error at this stage. I have written it up with matplotlib, numpy and PIL to allow more automated transform estimation.
The overlapped section is cropped using array subsetting and channels are reassigned as InfraRed , Red , Green instead of plain RGB to form a False Colour Composite. Some of the misaligned sections can be seen highlighted. I also have 950nm and 750nm filters to test more detail in the spectral response. The compositing will obviously become harder and harder as a manual process till I build a stable mount, but I kind of like the extensibility with clip-on-mounting.
The solution is to use the well developed feature based image matching techniques and let feature descriptors like SURF, SIFT or Harris Corners pick up the bits I picked up by hand. The spectral variation provides additional challenge.
I finish off with the composite built so far. Low costs systems like this can be used for environmental studies where lugging large cameras and spectrometers around rough terrain is not pleasant.
Monday, September 20, 2010
Processing TerraSAR-X in Python and R
Finally some 12GB of TerraSAR-X Quad-pol data finished downloading. I have essentially 3 PolInSAR capable sets (if the notorious X-band coherence holds up). I can process them in RAT but that requires converting them to floating point and more bloat, the TSX data is in a CInt32 form. Solution was to use GDAL's TerraSAR-X Cosar support and read subsets directly into Python. I took this opportunity to do some nice unit testing in Python. The result was the simple monstrosity here. It extends tsx_dual class I had implemented before.
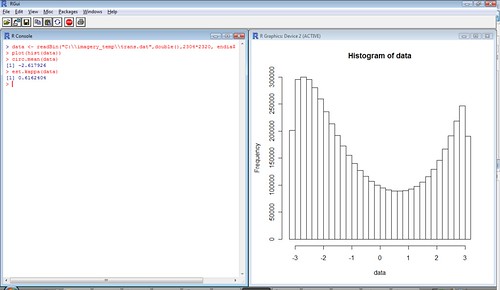
Then I moved onto some phase difference statistics and encountered for the n-th time the nicely non-Gaussian von Mises distribution. Trying to use R Circular Statistics from Python became the bane of my existence tonight. RPy2 current code is unsupported on windows so I am lacking package import. At least I managed to hack it into compiling with the following tricks:
/* on some platforms these are not compile-time constants, so we must fill them at runtime */
+ NAInteger_Type.tp_base = &PyInt_Type;
+ NALogical_Type.tp_base = &PyInt_Type;
+ NAReal_Type.tp_base = &PyFloat_Type;
+ NACharacter_Type.tp_base = &PyString_Type;
Now to figure out where to put it and von Mises are in Python.
PS: So it is "Talk like a Pirate Day" so "R - ARRR in".
Then I moved onto some phase difference statistics and encountered for the n-th time the nicely non-Gaussian von Mises distribution. Trying to use R Circular Statistics from Python became the bane of my existence tonight. RPy2 current code is unsupported on windows so I am lacking package import. At least I managed to hack it into compiling with the following tricks:
- Copied Rinterface.h from R source distro
- Hacked Rinterface.h to remove uintptr_t typedef
- Hacked na_values.c to remove dynamic allocations (compile time non-constants)
- Copied R dll's from "bin" to "lib" in R install
/* on some platforms these are not compile-time constants, so we must fill them at runtime */
+ NAInteger_Type.tp_base = &PyInt_Type;
+ NALogical_Type.tp_base = &PyInt_Type;
+ NAReal_Type.tp_base = &PyFloat_Type;
+ NACharacter_Type.tp_base = &PyString_Type;
Now to figure out where to put it and von Mises are in Python.
PS: So it is "Talk like a Pirate Day" so "R - ARRR in".
Monday, September 6, 2010
Waving around in MEEP - Scheme and Python
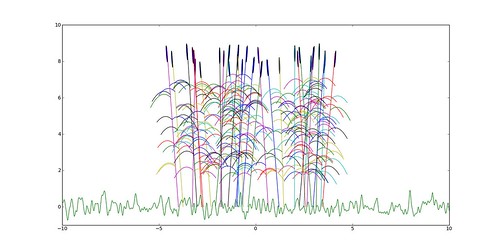
I finally get to learn some proper functional programming with MEEP and its Scheme based interface. MEEP is an FDTD - Finite Difference Time domain based simulator for electromagnetic waves, something I am trying to shoehorn into vegetation simulation. There is thankfully prebuilt cylinder primitives I can use to generate stems. So far I have managed put them in the Z and X axis and not in the Y axis which is of interest to me. The ring demo runs fine with some modifications and produces some nice and weird looking waves. Scheme is pretty easy to get around as a scripting interface, in spite of some polish math notation ( + (+ (+ (air water) earth ) fire ) = hooray !!)
I also got the Python bindings up and running. Time to see if my Python generated plant geometries and soil surfaces can be plugged straight into a 2D MEEP run. MEEP supports cylinder, ellipse, cone and block primitives. Making plants will be fairly easy, may be I can make the soil surface with dielectric blocks of random size.
Sunday, September 5, 2010
Building a PID controller for the Quadcopter
My students have finally taken some inspiration from the mechanical engineering folks and started on building a PID controller for the quadcopter using simulink blocks and various experiments to measure the angular acceleration produced by the motors. They are still far from having a rigid-body simulation of the system but apparently the PID controller in simulink can be stabilized. Another challenge will be to port the PID controller to Python, building a rigid-body simulation can be attempted with PyODE.
They had also been asking for a block diagram and/or circuit diagram. So I obliged with an Inkscape block diagram, circuit digrams are best left to the manufacturing professionals of Arduino and Gumstix.
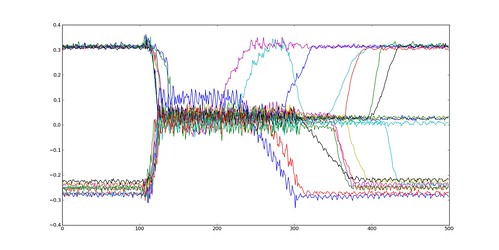
The measurement of angle with time shows non-constant angular acceleration, but the curves can still be fitted with a second order polynomial. The angular rate curves look even more quadriatic, indicating increasing acceleration with time.
Extracting the acceleration from this should be pretty straight forward as long as we fit a polynomial to a relatively safe part of the dataset. I think a fair number of reptitions and logs of the same experiment will be needed to smooth out the wiggles.
Subscribe to:
Posts (Atom)