Working in a small software team you often do not have perspective on what fancy names workflows have come to have. I read through the scrum article and seems surprisingly like the ad-hoc stuff I have been doing.
I like wearing many hats, but I realize now that they are all "pig" hats. I am fully committed to developing the solution and constantly under brownian motion from the chicken pecking me with requirement creep and feedback and forecast requests on the status. I would like to lock down the scrum and move forward, I want a referee who resets it when we spin. Teams need a strong scrum-master, I do enjoy being the pig and not willing to switch.
Tuesday, December 29, 2009
Skimping on dev dollars is disastrous
This is going to be a full on "rant" so stand back. I have been looking around on Elance lately for freelance dev jobs, plenty of stuff around as are developers from Russia and India. Not only developers, entire "teams/companies" with 100's of thousands of escrowed dev dollars to their name. The hourly rates are pretty affordable $12 or so max, but the quality of goods delivered I cannot speak about - unless of course I shell out some cash and get something done.
A cheap non-working implementation is the Vodafone India online payment site. Why couldn't they have cloned or reused the perfectly working Australian one. None of the features on this site work - not the the credit card payment nor the bill viewing, not even the complaints section so that I can give feedback on stuff not working. Come on Indian devs make me respect you and build something that works.
When I first wanted to use it I had to call up the "yes the callcenter" (hate callcenter jokes about me out here). The guy promised to send me an activation SMS in 2 hours - it did not come in 2 months. I had to storm into the shop and demand some answers, then the SMS was delivered in the next 2 hours. Vodafone should really do something about their service out there - not that Australian telcos are any better.
Monday, December 28, 2009
OpenStreetMaps + Multi-temporal X-band SAR
I am making some progress in analyzing the rich AGRISAR 2006 Dataset ESA has so generously provided to me. The K-Means and SOM I implemented in QGIS are now coming in handy for classifying various crops and detecting in-field variations within the same crop - to validate in-field variations there is also harvester data similar to what I have worked with in the past, just noisier.


I overlaid the Open Street Maps data on top of the SAR imagery and there are some new town/villages missing from OSM. If I can't detect any yield variations at least I can digitize some urban area polygons for OSM.


I overlaid the Open Street Maps data on top of the SAR imagery and there are some new town/villages missing from OSM. If I can't detect any yield variations at least I can digitize some urban area polygons for OSM.
Sunday, December 27, 2009
The right colour table - SOM Classifier
The Konohen Self organizing maps produce the projection of multi-band data onto the optimal subspace in 2D capturing both the spectral and spatial characteristics of the data. This is a very interesting unsupervised classifier. The results obatained from it can be scaled bilinearly to cluster classes, a 16x16 SOM classifier produces 256 classes. Here is again the classic landsat sample with 256 SOM classes.


Thursday, December 24, 2009
On the sports track - divers in OpenCV
Video tracking can be quite challenging. I compared 3 algorithms based on OpenCV for a tracking solution:


- Camshift - originally created for face tracking, it locks onto a blob with similar colour. In this case the colours are too similar with the background resulting is appalling performance from camshift.
- Optical Flow - LkDemo shows this technique in use. It works pretty well till an obstruction passes in front of the tracked object clearing all flow points. The flow points then need to be reinitialized.
- Template Tracking - Works much better than the other two. However does not regain lock after obstruction.
Monday, December 21, 2009
Foolishness of the Masses - Completed KMeans
 The urge to automate everything can be powerful (sudo make me sandwich) , often this leads to strange errors. Google trusts the wisdom of the masses and uses it to build a spell checker, nice instance of learning, but still automation. Sometimes the mass gets it wrong and Google follows suit. Today it threw a "did you mean ambiguus" in my face. Nevertheless ask the audience is always the first lifeline used - I haven't found clear statistics of lifeline usage by asking Google yet (so Google is not completely capturing the wisdom of the masses - have we stopped answering questions and started asking too many ?).
The problem of image classification which I have discussed in the past brings a similar dilemma, it is a question with unclear answers - which area of the image belongs to which class ? We can use supervised learning (capturing the wisdom of the expert) or we can let algorithms spot groups in the data (automation). In the end balance is needed between the two to produce "usable" results. The last OTB-QGIS plugin now implements one of the classic unsupervised classifiers - KMeans. I tried it out on the same landsat image as the one with SVM , the results are quite different.

Friday, December 18, 2009
Brains behind the face - working SVM in QGIS
Thanks to the excellent advice from Emmanuel and nice GUI design from Massimo, you can perform functional multiband/multiclass SVM from QGIS.
OTB comes with a detailed Classification Tutorial and there are samples in Monteverdi code to train the classifier using pixels in a polygon to generate SVM Models. Some vector reprojection code also helped.


I tried it out on a sample LandSat TM dataset supplied with ENVI. It has 6 bands, I digitized by hand 3 training areas - vegetation, light soil/rock and dark soil/rock. The current implementation only allows a single training area per label, this is a limitation of my patchy understanding of the OTB vector data attribute parsing system. Ideally any number of training polygons should be used if they have an attribute corresponding to the labels. Not a bad implementation for 3 days of work over a holiday, while running around buying houses.
Wednesday, December 16, 2009
SVM via QGIS - Move over Monteverdi


I tried to address this from the Qgis-OTB plugin with a single dialog, which allows setting 1 raster layer for classification and 1 vector layer for training (possibly created using the easy to use Qgis digitization facilities). All that now remains to be done is to hook up all the parameters + input dataset and you get supervised classification in Qgis.
Monday, December 14, 2009
Fixing hardware for free
In India people claim to smell a faulty ram and sell new ones. When it is just a loose connection. So taking apart and putting together a system for a friend - good practice for electronics engineers and geeks in general

-- Post From My iPhone

-- Post From My iPhone
Wednesday, December 9, 2009
Picking points to segment - Qgis+OTB
I have been pushing along the QGIS - OTB Plugin and successfully added map-canvas picking to inject seed points for region growing into the plugin. Though issues remain in reprojecting from map-coordinates to pixel-coordinates for the purposes of forwarding to OTB which works in pixel coordinates due to its ITK heritage. I have had some success with my test cases and the plugin builds on various platforms - Mac, Debian and Windows MSVC, yet issues remain. Such is the nature of distributed development, we will get there through the open process soon enough.


Saturday, December 5, 2009
Surfing and Simulating Surf
First day of surfing this summer - hurray !! It was fun, but we lasted only a couple of hours and I bet I will be sore tomorrow.
Sea-clutter and simulating it has been a long fascination in the SAR community. People have flown planes around in circles recording waves at various incidence angles and sea states. Made anlytical expressions of the dynamic ocean surface including larger waves, capillary waves, breakers and even foam. Put these through electromagnetic simulators like HFSS and tried to relate the observations to the simulations. Theorists keep on borrowing from graphics and making ever so detailed waves.
On the other hands the experimenters and statisticians haven't been sitting on their hands. There are myriads of distributions trying to model clutter amplitude statistics like the classic k-distribution and the kk-distribution. These try to fit the observed values to a statistical pattern and predict the extrema in the sea-clutter which influences the probability of detection of a target in this environment.
Papers have been plenty, but as one of my colleagues (thanks for the long talks about your lack of belief in statistics Marion) points out. The target has to be detected at an instance, and statistics is not very good at working with small samples. All the work so far cannot predict whether we will see a crucial vessel in a single SAR image. The solution is to give the statistics a chance - build lots of sensors and observe repeatedly.
Tuesday, December 1, 2009
OTB Qgis plugin - Linking through hell
OTB was having trouble linking to shared gdal libraries, and Qgis was having trouble linking to static gdal libraries. The two had a fight and split the baby into halves - and I am king Solomon. That's the level of my poetry after a couple of sleepless nights. At least I have managed to build both Qgis (with dependencies injected from Osgeo4w) and OTB. Thanks a lot Jef, Timlinux, Emmanuel and Julien. Here is a screenshot of the OTB plugin in Qgis menu. I am planning to extend this to bring the full gamut of OTB capabilities to bear in Qgis, including Feature Analysis, Classifiers, Atmospheric corrections, Radar geometric and radiometric correction and more. Interesting times ahead.


Map making in the family - maps in Illustrator and Photoshop
I was pleasantly surprised to learn that one of my aunts is making maps for an Atlas. Map making is officially in the family now. Cartography is a visual thing and she does all the prettyfication and compostion in Photoshop, Illustrator and Corel Draw. She showed some interest in worldwind and I tried to introduce her to Qgis, now we need to add Inkscape like annotation and composition support into it. Here is one of her sample maps - it is my home state. Only state in India with the Himalayas to the north and the Ocean to the south.


Saturday, November 28, 2009
Managing Terrain in WorldWind Java - Trees in Denmark
Recently I talked to Thomas Knudsen from KMS, apart from discussing matlab vs octave and kriging vs other interpolation techniques. Finally we arrived at the topic he was presenting on, producing consistent DSM from Lidar. Lidar is notorious for the difficulty in tying multiple flightlines together, a problem KMS solved with their stock expertise in gridding (KMS pioneered a few variants of the kriging method). Interesting side note Picasa would not accept the picture as sent out of my iPhone - fix the bug in your Exif reader Google.

Thomas talked about the 2 Lidar companies they hired to collect the whole country since only 1 could not get the job done. I was reminded of the Scankort DSM data available via worldwind. Apparently Scankort went bust due to management failure and was gobbled up by Fugro. Somehow in the turmoil the data was released to NASA and is available for us to enjoy KMS's work.
For a few beers (not delivered yet) I hacked up a terrain manager to go with World Wind Java , so that you can turn the DSM on-off and compare with underlying SRTM. The results indeed show trees, while SRTM shows - well tree hills.
DSM

SRTM

Thursday, November 26, 2009
When Licences hit the roof - Fuzzy Licencing policies
Being an Open Source guy software licencing always sounds iffy. There are though all these software licencing giants - they must be doing something right. The model hinges on selling using rights to the nuggety core code and surrounding it with a halo of hyped marketing and some very good service.
Oracle licences stuff per core with funny multipliers for diffrent CPU vendors, before the acquisition People Soft used to licence its product my a magic company valuation formula. The stock prices should have been set by how much a company's PeopleSoft licence costs.
Most vendors except the largest ones use a 3rd party licencing tool like FlexNet, whose older versions are very weak. The fixed number of licence idea be it attached to cores or to users creates an artificial ceiling which may halt production. In the financial industry the solution to limited cash is credits be it over drafts in cash accounts or margin lending for share trading. Since software licences are just as ephemeral and dynamic in value as currency, and most licence servers have extensive usage statistics measurements - software licencing should be fuzzy.
Fuzzy software licencing means degrading performance e.g. code efficiency and available runtime reduction when licences are overdrawn. If the financials can be sorted then an intermediate point to the Software as Service (SAS) model - bills are generated for extra usage.
Scalability in any process is always an issue, but with economics being like the weather maintaining operations at full scale is not feasible. May be the idea of pop-up shops will catch on.
Wednesday, November 25, 2009
Staying in production - heartbeats and jump starts
At FOSS4G I saw a very nice presentation by Andrea on maintaining Geoserver in production and optimizing performance. It is all nice and good with the jvm flags to squeeze more juice out of the hardware, maintain more objects in RAM, run parallel garbage collect and the lot. For the data server to keep running it needs :
PS: Warning before touching anything (thanks arneke).
- CPU(s) - Multi-threaded request fulfillment
- RAM - To do map composition, reprojection, format conversion
- Database - To draw spatial data out of, vector data greatly benefits from being in the database and being indexed
- HardDrive/File Share Service - Raster data is best drawn out of stripe-raid drives (0,5,0+1 depending on your budget).
PS: Warning before touching anything (thanks arneke).
Sunday, November 22, 2009
The importance of the generalist
In the fast moving technology industry things evolve fast and fast evolution entails fast extinction. Unfortunately humans have some 50+ year life span and can't afford to go extinct like databases and operating systems.
If you focus and develope extertise in one particular technology chances are its lifecycle will end in the near future. In the last few years of my professional life I have worked on and used myriads of open-source projects in the geospatial and scientific arena and seen plenty of them go extinct and the developers join the new kid on the block. There was a presentation on extinction, evolution, survival and dominance with respect to openlayers at the FOSS4G. I have seen similar evolution in World Wind .NET and Java. Once the java version became embeddable in other applications the viral mutations increased.
Jack of all trades, master of none, though often better than a master of one - Adam Savage
Knowing C# and Java is not a great deal but it helps transition. You have to know Oracle, MySQL, MSSQL and PostgreSQL since you never know what the next client or 3rd party software team you are working with will use. Your stuff has to work on Windows (2000, XP, Vista and 7) , Linux, Mac and possibly Open Solaris as well. The graphics engine on windows will need DirectX and OpenGL duality since some graphics cards are partial to one or the other. The server code will have to span PHP, Python, Java, Perl and some C++ based CGI/FastCGI. With all these you will have to keep learning all the countless new things Microsoft keeps churning out and the projects that keep on fighting for a foothold in the open-source ecosystem.
The best skill you can get yourself overall is learning how to learn, stop being piegeon-holed and look at the broad swath. Only coding will not get you there, programmers are not divas they don't succeed on sole capacity and reap huge salaries. They work in teams. Billy G in addition to being a decent coder is a ruthless and astute businessman to get the company where it is today. Oracle has to have an evil genius at the helm. Ignoring human relations and business mentality is not an option.
Just get the job done as best as you can, do whatever it takes - be a generalist.
Friday, November 20, 2009
Building the Orfeo Stack
Orfeo Toolbox (OTB) is a great symphony written in C++, or is it Opera ? I believe C++ in spite of its ceveats is one of the most portable langauages, a great choice for something demanding maximum output from the hardware such as an image processing application.
With inspiration from music with names such as orfeo and monteverdi, OTB puts together a fair few heavy weight projects. Not only in using them as libraries but being more than the sum of its parts. The developers also merge and maintain patched copies of these dependent projects in a mercurial repository ensuring a supported version is compiled against (a lot of the dependencies are merged from repository heads so much more recent than releases).
The dependencies are gdal, ossim, ITK, FLTK , OpenThreads, expat, liblas, etc. The cmake build system with the monolithic repository containing most of the other libraries makes getting up and running from a checkout relatively painless. Now I need to build the python and java bindings and try out some Qgis plugins and on demand image processing from GeoServer.
Tuesday, November 17, 2009
Cyber cafes and Upload Cafes
I blew a massive hole in my budget by using my Vodafone datacard in India to download 70MB at 1c a Kb. That's a huge load of waste for my net addiction. This could have been saved by using an internet cafe. Cyber cafes are ubiquitous in India, where household penetration of internet is low. Post Mumbai shootings, these cafes have become overcautious and if you show up even with a hint of a beard they will not let you use the machines without a full ID check (ID checks are everywhere actually - nobody believes you are who you say you are).
Moving back into another country - Australia. Internet penetration to homes and mobiles and everywhere in general is very high. The government does a lot of its business there (though I have heard of agencies which have 1 automated reply email saying they don't accept emails and provide you their physical address). Here the cyber cafe is very niche, possibly in the fragging niche in China town where people folk to play WoW and Counter Strike. The draw here is the low low lag times provided. The bandwidth is not a huge issue with gaming protocols these days since the maps are cached.
I was thinking of the business case for an upload cafe - a spot which provides high bandwidth upstream access similar to a data center - but on a casual basis. Large volume business data sharing is becoming the norm. There have been demonstrations in South Africa about the pigeon protocol being faster than the local ISP's upstream bandwidth. The download speeds in cable and adsl2+ are impressive. Yet the upstream needs a lot more work. You could choose symmetric ADSL if large uploads are your thing, but you are stuck with copper upstream on cable. I will use such a cafe to upload my hour long cooking videos to youtube or 100's of holiday photos to facebook.
Monday, November 16, 2009
Nearmap - Dense observation of space-time
Nearmap has finally had its public data release. Nice slippy maps view and you would expect in any web 2.0 mapping site. The biggest difference is you can make the time slip in addition to space - every capture date has a separate set of vertical and oblique views as well as separate stereo elevation model.

As with any large automated system e.g. Google the onus is on the users to find anomalies and QA the huge volume of data.


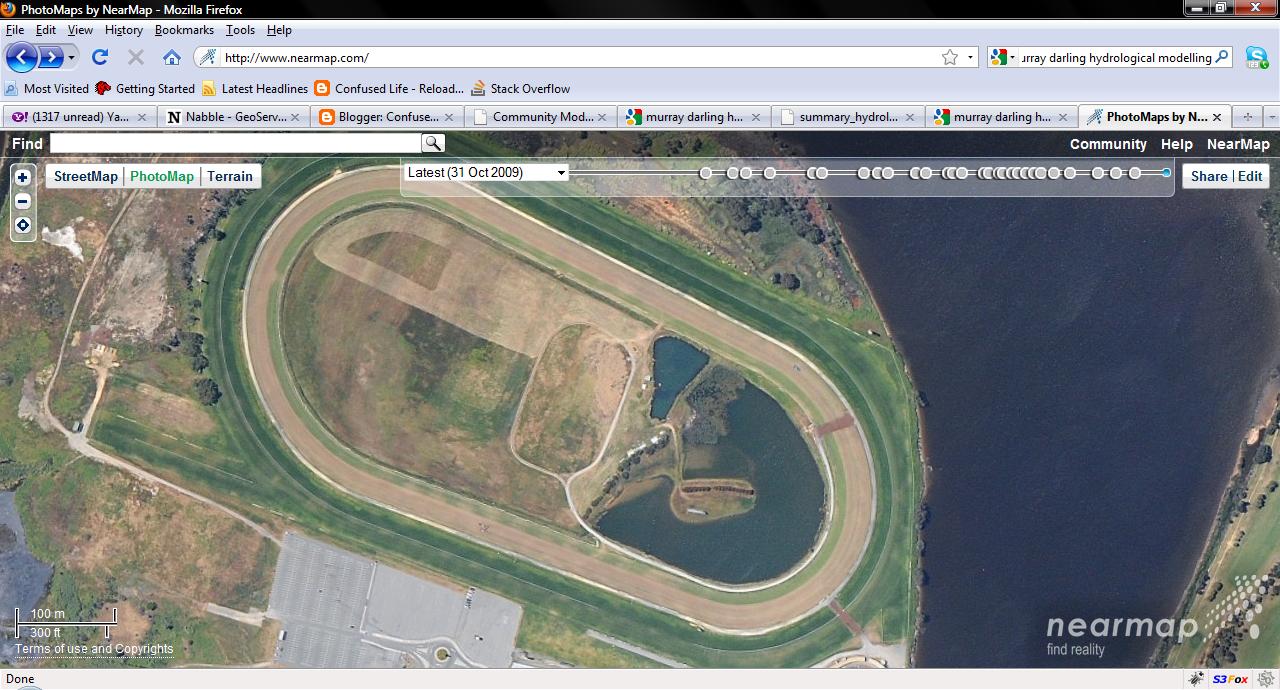

There are indeed some anomalies in the non-vertical modes over Adelaide. I hope they will take user feedback and improve the processing flow fulfill the great promise of recent aerial, elevation and city models this system holds.

Saturday, November 14, 2009
Floating around in Singapore
Due to the night curfew in Adelaide, flights from Singapore to Adelaide can only leave for a 12 hour period. So if you are unfortunate enough to arrive at the wrong end of the half-day stick you will have to stooge about in the Singapore airport (not that it isn't huge and a shopping paradise) or the fine city of Singapore itself.
I booked a random hotel near little india from the airport, which turned out to be a stones throw from electronics Mecca of Singapore - Sim Lim. Most of my day got sucked in there, staring at gyros and brushless motor, some super compact hard disks and the newly affordable handheld FLIR sensors post H1N1 scare.
I managed to catch up with one of the top Orfeo Developers via Linked In. We walked around a bit dodging police cordons which had blocked off a fair few roads because of APEC. Managed find a decent bar with a sofa-bed next to the pier and chatted about IEEE standards for floating point over a couple of beers. I am indeed a splendid conversationalist.
Tuesday, November 10, 2009
Writing JUnit Tests in Geoserver
In order to get a community module promoted to extension status I had to write a couple of unit tests with JUnit. Geoserver strives to be production quality software so unit tests are quite handy, for agile programming as well as regression testing. Making tests pass through taking short-cuts is quite easy but usually very unwise. I did have to take the copy-paste short cut route though, since the generic DefaultMapProducerTest was hardcoded with the "image/gif" output format and I was not in the mood to make core changes (outside my tiny module).
Well now a couple of tests are written and the module code passes them and works as expected in general, time to petition for inclusion as an extension.

Well now a couple of tests are written and the module code passes them and works as expected in general, time to petition for inclusion as an extension.

Monday, November 9, 2009
World Wind wins the best software of the year award
Another triumph for open source - NASA awarded World Wind the software of the year. More details are in Bull's blog. I obviously missed the boat on this one through family issues and trips to the Ganges to purify the body and soul - don't go by the grey mushy appearance of the river, if you believe it will purify you.
(8:52:08 PM) arneke: life is full of black boxes comes with a really crappy debugger ;)
At least World Wind is not a black box and the Java debugger is pretty good. You can quickly track down the issue and fix it, that is IF you are not using JNI and calling Native code. This can be the case with calls to the Native JOGL and various associated graphics card issues. Watch out for those - since death will soon follow.
Sunday, November 8, 2009
Error message annoyance
One of the reasons users get frustrated with software is the inane error messages we programmers inject into it without consulting a sensible psychologist. This is the reason a lot of people have no clue what went wrong when something does go wrong - a stacktrace may be useful to us, but is garbage to the user. This is pointed out aptly in this comment.
Recently I was watching the demo video of an Enterprise document management platform - Documentum. The product video shows odd error messages and things you cannot do rather than things being simple, sort of product I would flinch from spending millions on.
Recently I was watching the demo video of an Enterprise document management platform - Documentum. The product video shows odd error messages and things you cannot do rather than things being simple, sort of product I would flinch from spending millions on.
Wednesday, October 28, 2009
Model Invasion of Adelaide
I started playing with the code that has gathered up in the 3d-Models forum thread in Worldwind. Basically dumping it into eclipse and running it, ultimately I want to load complex DXF models. But the dxf format is not simply faces/vertices/edges, so will require more digging around and understanding. At least Autodesk has a free viewer to make my life easier and check while I make progress. The same can't be said about other 3d formats. They also make the awsome 3ds-MAX, so I can possibly use that as a format converter.


Monday, October 26, 2009
Mapping the Arts and the art of mapping
One of my friends recently launched a digital arts initiative and I decided to check out the mapping arts program she had talked about previously. It makes heavy use of the Google maps/globe API and the google earth browser plugin to produce a content control interface via flash that the standard Google Earth would be lacking. Quite ingenious.
The bit of the program I especially like is the geek in residence concept. Now this is a rather personal interest thought - but making maps and making maps pretty is a fusion of art and digital technology. We even had a presentation in FOSS4G about making maps pretty. I would love to see a geek-art collaboration in this domain.
The bit of the program I especially like is the geek in residence concept. Now this is a rather personal interest thought - but making maps and making maps pretty is a fusion of art and digital technology. We even had a presentation in FOSS4G about making maps pretty. I would love to see a geek-art collaboration in this domain.
Security through obscurity - virtualization and spoofing
In a comedy of errors I managed to completely lose access to a machine. Underlying hardware windows IP stack got taken over by a Linux stack in a VM with bridged IP ( I spoofed the host by assigning the same IP to the guest VM). I had perfectly inaccessible system (via network) with a windows machine pretending to be a linux machine for all intents and purposes.
Then I found an article on security through virtualization and spoofing, exactly what I had done by mistake. Here comes some more penicillin.
Then I found an article on security through virtualization and spoofing, exactly what I had done by mistake. Here comes some more penicillin.
Monday, October 19, 2009
Coding in Geoserver
I finally got my BIL/DDS code out and can start proving my community module to extensions status by writing some code coverage tests. Currently attending geoserver optimization workshop.
Wednesday, October 14, 2009
Developing inside GeoServer
Since Geoserver is such a nice implementation of the OGC standards, I decided to include WorldWind .bil format elevation output to it. The deployment of data is a breeze, just point geoserver to your file. There is already imagery output as .dds plugin written by an enterprising french man, but it requires maintainance. I will probably take over both of this "Map Producers" and get them tested and maintained as part of core geoserver.
Then we will have a proper Java WorldWind stack from serving to consuming and displaying.
Then we will have a proper Java WorldWind stack from serving to consuming and displaying.
Thursday, October 1, 2009
Reading about reading - Infinite Jest
While in a backpackers in Hobart , checked out and waiting for transfer to airport, I picked up a really thick book I had no hope of finishing in the time left - enter the "Infinite Jest". It was even harder to get through , reading it feels like swimming through treakle or may be the non-newtonian fluid, the faster you try to go through the more you get lost and are left unable to continue.
I have finally managed to procure it from the library and gone thorugh first 2 chapters - I have been forewarned about the non-linear nature of the book. So I will read it in a non-linear fashion and collate on the fly (yay for TCP). Let's see how that works out.
Another Wallace work is coming out in film this year - Brief Interviews , might read it first. The good thing about anthologies is that you can read them in bite sized bits .. lovely.
Wednesday, September 30, 2009
Drooling on the Arm
Arm based boards are becoming more and more powerful and complete with nifty peripherals like gpu, gps and accelerometers. Making them perfect for building autonmous platform brains on a budget.
-- Post From My iPhone
-- Post From My iPhone
Saturday, September 26, 2009
Playing god - messing with Terrain in WorldWind Java
I wish i could say I did this but, it is clearly in Italian. Very nice to see what can be done with the nice clean framwork WorldWind provides. This video demonstrates modifications to the mesh using a game sandbox like set of tools, now that feature should so make into the examples provides with the core library.
Wrangling with Curly Monkeys
I had some files delivered via FTP to me. Sounds simple enough - not really : the FTP server is apparently FTPS://. Oh great they are careful about security. Fire up FileZilla and try to download using FTPS. The nice feature in filezilla is that you can see the server interaction. FTPS RFC's defined implicit and explicit FTPS, the implicit version comes first in FileZilla options. The server threw me out with an EABORTCONNECT on port 990 (FTPS Implicit port). More self-education and I realized that the FTPS implicit is deprecated. Explicit FTPS is on port 21 using TLS. So that worked out fine till the server timed out the connection, it was not really fast to start with (6.8kb/s). So I resorted to using curl , for future reference the command below can handle FTPS/TLS.
curl --ftp-ssl -# -1 --insecure ftp://user:pass@server/file -o outputfile
 So there was the curly bit, now let's move onto the monkey bit. I have an ATI Radeon HD 3670 card on the laptop, so I would rather use AMD/ATI graphics tools, namely RenderMonkey. I did some simple brightness contrast shaders in it looking to implement them in JOGL. That didn't quite work out - so more wrangling with monkeys is needed.
Thursday, September 24, 2009
Giving answers - messing around at Stack Overflow
I got onto SO a couple of days ago. Since then I have learnt an incredible amount of Java and Python via the quickfire question-answer system. There are interesting community bits too. It is almost like an MMO in design, the only monsters to hunt are niggling technical problems. Here is the joke of the board in my opinion and a solution to an important user satisfaction issue - load times.
Load times and data streaming is what has made the whole load pages by bit movement in the new internet design so popular. Good design makes portions of the content to the user and the input from the user atomic, allowing partial refreshes. People expect instant responses (within 1/16 second) - a lot of other factors come into play while delivering this:
Load times and data streaming is what has made the whole load pages by bit movement in the new internet design so popular. Good design makes portions of the content to the user and the input from the user atomic, allowing partial refreshes. People expect instant responses (within 1/16 second) - a lot of other factors come into play while delivering this:
- Server processing capacity
- Network bandwidth
- Client machine rendering capacity
- Concurrent users
- Any other bottleneck you can think about
Tuesday, September 22, 2009
Economics of Chip Making - cut throat market
There was a very old story I was told once about 3 chips that could be - Zilog Z80, Motorola 68000 and the pre-maturely born Intel 8086. The early release, familiar instruction set and price gave 8086 such a boost that we still have it around.
Given all the publicity about AMD - Intel rivalry it is interesting to follow what works in this arena. AMD had to split up design and manufacture, Intel might be following suit. Motorola spun off Freescale long long time ago.
Problem then as in now is the familiarity and usability of the instruction sets and the chips, the efficiency and transparecy with which silicon is exposed to the neurons. I researched some more on the new instruction set on the block, the GPGPU. I wish I could tag cloud the projects using Nvidia Cuda vs those using ATI Stream, but here is the googlebattle result , Cuda is nearly twice as much used as ATI stream.
There are some heavy-weights putting in behind Cuda, the very hot Lapack creators making MAGMA, with blessings from Mathworks and Microsoft. Microsoft itself making a GPU computing extension in Windows 7/ DX11. Not to mention GPULib from Tech-X, which has led to some very interesting experiments in remote sensing image processing. The core of all this comes down to my laptop having only an ATI Radeon and no decent GPGPU capability to play with, best of luck to AMD getting its house in order.
Wednesday, September 16, 2009
Riding around in the rain
Hobart has some pretty good bike tracks if you can handle them in the wet in an unfamiliar ride. Went up a hill mostly on foot because I could not get the gears figured out - me and the gears haven't been friends this week, same problem in the rented lancer with it's semi automatic gears which automatically switch down but not up.
Downhill bits were fun where I had the guts to ride it and not slalom through trees. Had to scrape some concrete on the way back, brakes would not pull out enough speed - hence grazed elbow and knee nothing serious.
Need to whip around the hills a bit more when I get back.
-- Post From My iPhone
Downhill bits were fun where I had the guts to ride it and not slalom through trees. Had to scrape some concrete on the way back, brakes would not pull out enough speed - hence grazed elbow and knee nothing serious.
Need to whip around the hills a bit more when I get back.
-- Post From My iPhone
Saturday, September 12, 2009
Maintaining the fantasy - while the real people sleep
I was just reading on the Warhammer Online server architecture and hosting system in the Intel Zine. Fascinating description of what is essentially an AI simulation system with global deployment. Interesting are also the parallelization and maintenance systems. WAR uses application level parallelization and inter-process communication with TCP, forking of processes to deal with keep sieges and trying to minimize the instancing. The update system uses the hardware level access provided by blades, I am sure I would be scared if I was instructing the bios to eject and load a new CD and install a full os off it.

Luckily WAR is not so heavily populated and you can have some great large battles. The quality of the players is decent and the transition between RVE and RVR is smooth.
I wish similar efforts were put into dealing with real world problems and modelling it while we slept.

Luckily WAR is not so heavily populated and you can have some great large battles. The quality of the players is decent and the transition between RVE and RVR is smooth.
I wish similar efforts were put into dealing with real world problems and modelling it while we slept.
Friday, September 11, 2009
Right brain and left brain - CPU and GPGPU
In the good old days the hallmark of a scientific workstation was a math coprocessor , today we have supporting processors everywhere - in the GPU, network card, sound card. The purpose of the CPU is to be jack of all trades, manage all the crazy hardware and execute instructions. CPU's excel in path prediction and multi-tasking. Whereas the GPGPU does flotaing point arithmetic faster and a lot of them in parallel - just what you need to apply filters to raster data, perform finite element analysis or fit an isosurface to a point cloud using local data. Loading instructions into the GPU has traditionally been the domain of the graphics programmer. The major graphics vendors NVIDIA and AMD/ATI are now locking horns on making this just as easily accessible to the CPU user.
The two companies have competing technologies - CUDA and Stream SDK. The diversity between the camps makes the coders life difficult in using the GPGPU and supporting all platforms. There are people scratching this itch in making API's to do data parallel tasks independent of the enabling technology. Most are still at their infancy - I wish all the best to Pygwa. AMD is well positioned to eventually integrate the GPGPU architechture from ATI into its mainstream CPU's - seeing the challenge Intel is making noises about Larrabee. I would love to get my hands on all 3 for now so that I can implement a covering python layer to perform data parallel eigen decompositions.
Having said all this still I am not sure which one is the right brain and which one is the left - it seems the one obsessed with doing the same task in parallel and maths produces most of the art (GPU) and the one that is flexible, predictive and moves around laterally does all the mundane word processing (CPU).
Playing with words - wordle
I saw a post summarizing a confernce program via a wordle word cloud. So I decided to do the same to my old blog which I can't write anymore. The results are frankly surprising. The word I talk about mostly is apparently beach. Here was thinking I was writing a mostly scientific and programming blog. I had a relatively short night out tonight, need to pack a bit and get ready to head off to Tasmania on Sunday. I have a sneaking suspicion that wordle only parsed the recent posts which are about my trip to Bali, but it is a nifty toy indeed. I will have to throw it at my thesis at some point when it is done.

Thursday, September 10, 2009
Fusing information - when means don't cut it look at variance
Interpreting what you see can be a challenging task for the brain. We have a lot of mental resource dedicated to processing visual information but still a lot of illusions get past us, mostly due to lack concentration or presumptions which prevent us from paying attention to certain details.
The standard assumption for detecting an oil spill/slick in SAR is that the oil reduces surface tension and dampens capillary waves, flattening the sea surface and reducing backscatter. Other natural means may have the same impact, mainly doldrums and calm sea conditions. The power spectral densities in both of these sea surface anomalies can be very similar. The slicks however differ in textural infomation since the oil does not heavily dampen the natural wind driven waves, causing the oil to form streaks. Instead of the slow to compute but detailed texture filter banks or occurrence/co-occurrence measure, simple kernel based variance measures may help distingish streaky oil slicks from just plain old calm sea.

The West Atlas rig leak becoming a long drawn out affair and claims and counter claims everywhere with no material evidence, observing the dynamics of the slick can be important. Sometimes not only does the wind play a part, the bathymetry takes a role as well. The Timor Sea has resources worth billions shared by Australia and East Timor. The Envisat images show a lot of dark areas in the sea which can only be differentiated by texture. The oil seems to be dispersing at a bathymetric feature and right at the dispersion point is a QuickBird image, in the middle of the ocean, taken quite a while ago in May. I wonder what is so interesting there.
Wednesday, September 9, 2009
ESA uses NASA Software - to look at oil spills in Australia
Europe and America have always had a close technological co-operation, especially in the space sector. While Europe has major progress in the Radar domain, America has stayed behind, but another area where Americans, namely NASA made a huge leap is in making an open-source globe visualisation tool, WorldWind. Now the European Space Agency (ESA) is using this as their archive display and ordering system backdrop in EOLi , as opposed to the rather dated and hard to use 2D map they used to have.
One of the advantage of using WorldWind is that the preview images can be quickly loaded up into the globe overview to provide the user context and also allow exploration of the data history even before ordering. In the case of planning a future acquisition, the 3d display combined with a gazetteer makes finding the area of interest simple and fun.
Out of curiosity I checked on the on-going rather large oil spill near Ashmore Reef. Sure enough ENVISAT-ASAR had collected an image and I have a quick idea of how much the spill area is without getting the full image. Detailed images from TerraSAR-X and Cosmo-Skymed can be found here.
Monday, September 7, 2009
Scaling Python applications - Parallel Python easy heterogenous clustering
Python is often accused of being a slow interpreted language, inspite of all the proof of being very easy to accelerate critical sections with native code and large projects such as Youtube being written in Python. Python is a great glue language holding together disparate bits of code and providing easy interface to multiple languages, an invaluable proto-typing tool.
I write some naive inverse distance weighted interpolation for a set of field data and it ran painfully slowly (taking 1 second per interpolated point). So I looked into accelerating this with Parallel Python , this was surprisingly easy to set-up and to recode the algorithm in parallel mode. It is embarassingly parallel with the same operation being done on each grid point. Extending from 1 laptop to 7 different machines resulted in around 3 times increase in execution speed. Admittedly I ran the job over wireless and some of the machines were windows desktops with little dedicated resource while others were servers running linux. However the excercise demonstrates the flexibility of Python.
I write some naive inverse distance weighted interpolation for a set of field data and it ran painfully slowly (taking 1 second per interpolated point). So I looked into accelerating this with Parallel Python , this was surprisingly easy to set-up and to recode the algorithm in parallel mode. It is embarassingly parallel with the same operation being done on each grid point. Extending from 1 laptop to 7 different machines resulted in around 3 times increase in execution speed. Admittedly I ran the job over wireless and some of the machines were windows desktops with little dedicated resource while others were servers running linux. However the excercise demonstrates the flexibility of Python.
Monday, August 31, 2009
I haven't been there - so I will just Interpolate
Though not as hazardous and short sighted as extrapolation, interpolation can be quite challenging and fraught with errors and pitfalls. Whenever data is collected on the ground it is not evenly sampled and smooth, there are system drifts as well as uneven motion of the sampling platform. In order relate this ground data to nicely gridded remote sensing data, from SAR or Optical platforms, interpolation is needed. There are lots of interpolation techniques, I will discuss some of the easier to explain ones here:

- TIN based - This technique relies on indentifying the 3 nearest non-planar points to the point being interpolated and fitting a planar or higher order surface to these points. The grid-point is then calculated as a point on that surface.
- Inverse Distance Weighted - This technique uses a weighted linear combination of all or a local subset of the known unevenly sampled points. The weights are calculated using various techniques e.g. 1/distance , 1/(sqr(distance)), exp(-sqr(distance)). If there are known characteristics in the sampling e.g. there is denser sampling in one direction, the weights can be biased to reflect this.
- Thin Plate Splines - Similar to the IDW techniques splines can be fitted to the full or local subset of the unevenly sampled dataset. Splines produce smooth interpolation results, but can have large spikes in sections if there are inherent discontinuities in the underlying data or large gaps.
- Geostatistical Techniques - Foremost of this is the Kriging technique which makes assumptions about the parametric distribution from which the sampled points are drawn and estimates the parameters of this distribution using maximum likelihood estimators. The assumption of spatial dependence may not be valid for widely spaced samples and statistical tests should be employed before the interpolation is used.
Sunday, August 30, 2009
Organizing Xtreme Programming - while riding a monocycle on a tightrope

Somehow I have got myself into organizing the IEEEXtreme 24 Hour Programming Challenge. I innocently sent an email to the chapter chair about it, now it has landed on my lap to think up some programming challenges. I will appreciate ideas.
Coding WorldWind will be great but they only support Mono and Java so it is definitely going to be for WorldWindJ. I have some interesting ideas I would like people to take a shot at. Other than that there are classic algorihmic excercises of sorting and searching, may be searching for a possum in Flickr public image libraries with the code implemented on Google App Engine or Amazon EC2 , just for the kicks.
Sunday, August 23, 2009
Wine trip Barossa August 2009

Another successful and messy wine trip. We attended the Barossa wine festival and got sloshed as usual. Some behaved like cats and some like monkeys, but we all had a lot of fun.
Friday, August 21, 2009
Inglourious Basterds - Let's Get Em

Very nice QT movie, albeit a fantasy unlike Valkyrie ( I can't stand Tom Cruise though). Brings out the monsters that are created during war. My favourite character in the film is Hans Landa for sure, he is comic smart and even to some extent caring for people under his command : Radio Op. He shows ratlike survival instincts that he is so proud of and a shrewd read of the tide of war.
Thursday, August 20, 2009
Staying coherent - come rain come sunshine
SAR is widely touted as an all-weather system, but weather can limit the applicability and vastly affect the interpretation of SAR data. Not only is tropospheric weather we are familiar with the cause of concern, at longer wavelengths ionospheric effects and Faraday rotation can become an issue, impacting polarimetry.
One of the impacts moisture in the atmosphere is attenuation and path length extension as the electromagnetic properties of the transmission medium change. This can impact interferometric applications.
In addition to instantenous effects on the wave propagation, weather be it wind, rain or may be a long spell of dry weather can have complex effects on the target backscatter. Grass may dry up and disappear from view. Canola crops and trees may wave and become motion blurred ( saw some marvellous examples of that at IGARSS). Rain and hail may saturate the ground making things suddenly darker/brighter. In such cases direct comparison even accurate coregistration becomes difficult. Theoretical modelling and experiments put the wind based decorrelation of trees to a few tens of milliseconds, putting limits on integration time achievable.
All this makes repeat pass interferometry very fickle just like the weather. Coherence can only be achieved in very limited areas.
Wednesday, August 19, 2009
The fallacy of classification
Classic remote sensing classification type problems try to lump ground features, lets say vegetation cover, according to artificial man made boundaries. These boundaries never model reality and hence the premises used to perform classification are false, this makes supervised classification unpopular. The other approach is unsupervised classification, where clustering techniques are used to identify naturally occuring variations and groups in the data; classes are built from clusters so identified. After this again comes the human intervention and learned or in some cases guesswork assignment of vegetation type to each class.
In between the 2 extremes are semi-supervised approaches, how strong the human intervention is determines the quality of the output from the classification problem. All this does not address the problem that classification itself is a fallacy, an ill posed problem and groups are not well modelled for algorithms to yield desired results.

Consider the data fusion scenario shown below with multi-temporal, multi-polarization, multi-wavelength SAR and Optical images. First and boring housekeeping is to register all the images together, which can be done after fair bit of fiddling, picking ground control points by eye (automatic registration does not work well across L-band SAR and Optical) and choosing a suitable non-linear transform to map from slant range to ground range ( why can't the PALSAR polynomial be easier to access and more accurate ?).
 Consider the hypothetical problem of classifying river, vineyard, centre pivot irrgation areas and scrub. The vineyard alone as a class is not well defined, there are leafless vines which are virtually invisible in optical but visible in x-band SAR. The river has bright pixels in SAR which are tree trunks sticking out of the water forming dipoles. Pure pixel based statistics will fail at classification here. What can be achieved is the appreciation of the variablity and the detail visible in each cover type at different wavelengths.
You can work it out by Fractions or by simple Rule of Three,
But the way of Tweedle-dum is not the way of Tweedle-dee.
You can twist it, you can turn it, you can plait it till you drop,
But the way of Pilly Winky's not the way of Winkie Pop!
- Rudyard Kipling (Jungle Book)
Saturday, August 15, 2009
Oh pretty flowers !!

Finally back from a couple of days of running around in wheat, beans and other fields. Of course dodging suspicious country folks and whistling bullets ... just joking. I just got stopped once by a guy in a red car, he only took my card and said he will check with my office whether I am real. He also did not seem worried about some tiny samples. Saturday was a great day for the field, sunny and not so cold and windy. Covered a fair bit of ground and grabbed as many points as I could.

Then managed to make it to Walaroo in time for sunset and dinner, which was a bad idea since someone took this opportunity to steal my car park in the hotel and I had to park in the street. Sunday morning turned out to be windy and rainy and super grey. So I managed to do only a couple of points. On my way back near Balaklava (that name still cracks me up), I found a beautiful canola field worth exploring ... er if you are crazy like me.
Monday, August 3, 2009
Meeting Maurizio
I had an eventful arrival in Jo'Burg. The cab driver had no clue where my hostel was, even though it's a stone's throw from the airport. I had to whip out the iPhone and guide him. Come on Google make routing work in South Africa, people will so use it during the World Cups-2010, especially since cabs don't have a GPS. Anyway I got distracted and left my laptop in the cab. More Googling for the airport number followed .... eventually I got it BACK !!! Apparently a 1st in Jo'Burg.
Then I hopped on whirlwind tour of Johannesburg and Soweto, which ended at the Hector Pieterson museum. Then I nearly got left behind by the tour bus while shopping for souvenirs.
Finally the tour dropped me off at Maurizio's place and we spent a fair few hours discussing life, economics and tile serving. Thanks a lot for your hospitality Maurizio, I had a great time.
Thursday, July 30, 2009
Addressing Mang'u High

I finally addressed the whole assembled school in the newly built chapel at Mang'u. I pointed out the very healthy competition we had in our class and the great opportunity they have to learn basic principles which they can continue to use throughout their life. Electrical Tech. made doing an engineering degree in Australia a breeze. The ability to speak some French has made me many friends.

In the second part I tried to introduce satellite remote sensing and probably managed to throughly confuse everybody. The speaker following me was Prof. Chege who is an economist and works as an adviser at the Kenyan Treasury. He talked about University after high school and steps to take to go to Ivy League schools in the US - a couple of Mang'u men from last few years have ended up in Yale and Harvard.

Afterwards we sat around in the principal's office and discussed how the old boys can help the school. May be one of my photos will end up on the wall in the school.
Wednesday, July 29, 2009
Back in Kenya via Cape Town
So I am getting to write another blog entry within 2009. I have rarely used the blog to express myself since I started using Facebook. I guess a blog has less sinkage from a million of other entries.

Anyway I am back in Kenya visiting my parents and organizing reunions for Mang'u Y2K. In this trip I also went to South Africa and presented at IGARSS 2009. My work got positive comments from J.S. Lee which was a big plus.

We had a standard reunion at Kengeles on Koinange street and got to catch up with people I haven't seen in 9 years.

Then I squeezed in a couple of days in Zanzibar just to run around at the beach and visit the world heritage stone town. I also got to learn a lot about spices, wonder if it will improve my cooking.
Today I am supposed to give a talk on how I have fared post high school at Mang'u and inspire the current students. I wonder if I will do a good job.
Sunday, January 25, 2009
Collecting vine leaves

Finally dream fieldwork in a wine district even though it's only Riverland and they only make cheap wines. Driving around to 3 properties and chatting about lowered consumption of wine. Surely not due to me, all due to the global propensity to create fake money and put it in circulation.
-- Post From My iPhone
Wednesday, January 7, 2009
Papering on for POLINSAR 2009

Writing another conference paper - this time for POLINSAR 2009 in Frascati, Italy. Pity I don't have any funds to physically attend this one. The dual-polarimetric entropy-alpha decompositions are looking good. I did some of HH/VV by mistake and the results were quite strange. I need to analyze the mechanism for the HH/VV decomposition and interpret the results, there might be new bounds to understanding them.
I also got back into coding in RAT and added some scatter plotting capability, obviously helps in making the entropy-alpha plots and currently working on adding a geo-location framework.
Subscribe to:
Posts (Atom)
