Showing posts with label sar. Show all posts

Tuesday, November 16, 2010

AR2C Opening Ceremony - TechTalkFest

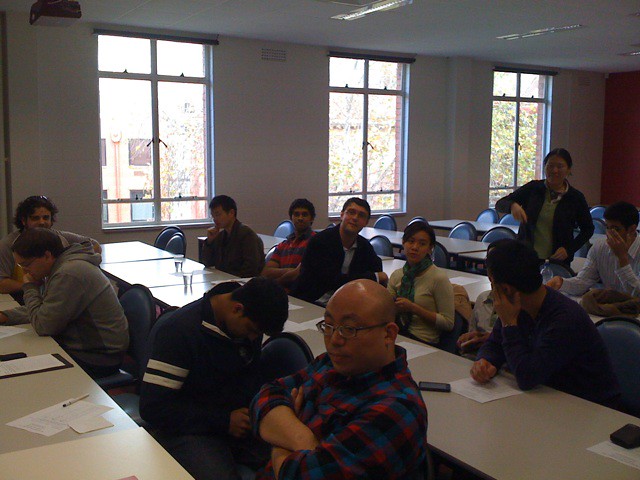
Yesterday we had the day long Adelaide Radar Research Centre opening ceremony. A self-funded collaborative research centre directed by my PhD supervisor Doug Gray. The talks ranged from highly theoretical to commercial to what reduced to a company ad (even though the speaker promised to not make it so).

I found the first talk most interesting, probably beacuse I was most attentive at the beginning of the day and it presented an irrevocable commercial success of Radar research. GroundProbe discussed their mine wall stability radar and how it came into being from concept to highly user friendly truck mountable versions.

The next talk was from Simon Haykin, dealing with the superbly abstracted Cognitive Radar. He kept drawing parallels with the visual brain and talking about layers of memory and feedback. At the end of the day, one of my colleagues asked if the Cognitive Radar is paralleled by the visual brain then where is the transmitter ? Auditory brains of bats might have been a better analogy.

The last talk before lunch Marco Martorella talked about ISAR and how ISAR techniques can be used to sharpen up blurred SAR images of targets under motion, such as moored ships rocking. However the ISAR results seem to flatten the image to a given projection plane and issues concerning 3D structure estimation came up. There seems to be no acceptable solution to this yet. May be some of the work done in Computer vision can help in this regard, particularly Posit and friends.

The energy level dropped a bit after the lunch break. Several people from DSTO took off to get back to work, some came in. The mixture in the audience changed slightly. The afternoon talks covered Raytheon, BoM and the Super-DARN system.

The guy from Raytheon talked about their huge scope in Radar systems, from the tiny targeting radars in aircrafts to GigaWatt beasts which require their own nuclear power plant. As well as their obsession with Gallium-Nitride and heat dissipation.

BoM fellow talked about the weather radar network which we have all come to know and love. Starting from the origins in World War II to the networked and highly popular public system it is today. They seemed to have a projective next hour forecast of precipitation along the lines I had imagined before, but only for distribution to air-traffic control and such.

The last presentation about SuperDARN had the most animated sparkle I have seen in a Radar presentation. It featured coronal discharges from the sun, interactions with the Earth's magnetic field (without which we would be pretty char grilled) and results of the fluctuations in the polar aurora.

Overall it was pretty interesting and diverse day. At the end of the day we were left discussing the vagaries of finishing a PhD and the similarities to Xeno's Paradox.

Wednesday, November 10, 2010

More Lollypop forests - in HFSS

HFSS Leafless Tree
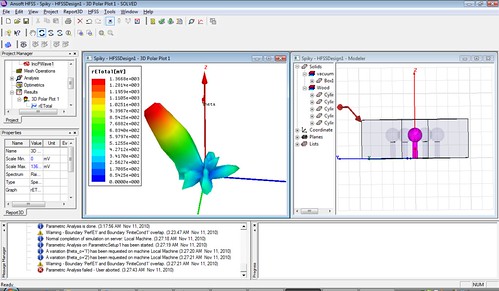
Heath from our lab gave me a primer in Ansoft HFSS and since then I have been muddling along to try and represent a forest for SAR imaging. I managed to get some of my ngPlant created models into it via STL from Blender, but beyond that HFSS was totally non-cooperative. The model refused to be healed to close any of the perceived holes etc. So my only option was ot make some Lollypop trees like before using the supplied primitives, in 3D this time. Fortunately HFSS allows quick duplication, scaling etc. of a single primitive and links them with transform nodes. In the future this will allow more stochastic forest generation rather than a cookie cutter one.
hfss lollypop trees

FEM kicks in beyond this point and calculates the scattered far fields with plane wave excitation. As expected due to the perfectly conducting ground plane most of the energy radiates away, but there is still some significant return towards the illuminating direction.The nice change from FEKO is that the fields are calculated in all directions, not just the illuminating direction. So this setup can be used to bistatic imaging scenarios as well.
ngPlant palm

Thursday, October 14, 2010

"Lollypop Forest" in Meep

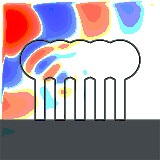
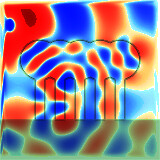
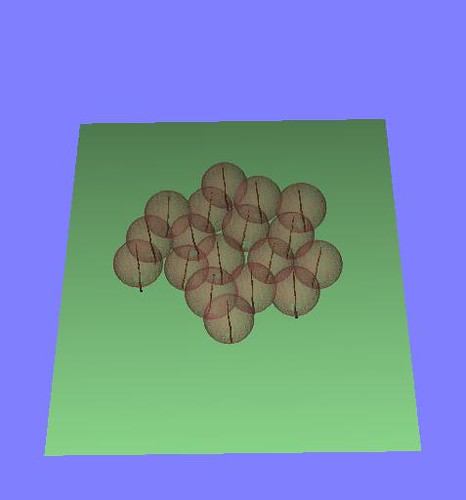
I finally made some semi-realistic, well only very grossly, forests in MEEP. With dielectric cylinders as tree trunks topped by dielectric spheres as canopy. Then I bunched a few of them together to make a forest of 5 trees. I could have made much more complex structures but my knowledge of MEEP primitives and how to generate more of them automatically in Scheme is lacking. The attempts at replicating results with python-meep haven't gone so well, so I have to stick with Scheme-MEEP for now. Anyway even with the simplistic forest the wave propagation quickly becomes rather complex and difficult to handle analytically without gross assumptions. Yay for numerical methods.

Lollypop Forest Start
Other small discoveries this week include the pagesel package in Latex for sending each chapter off to review, of course after you have done the whole document and you know where the pages go and apparently very dated model selection procedures in R. Even though it is dated it gave me a model with decent regression statistics - now to send off that chapter heavy with regressions for review.
Lollypop Forest End

Wednesday, August 25, 2010

Time to Rain with BOM Radar

BOM Radar loop is very handy no matter what you are planning, a bike ride, a dash to the bus stop or a picnic with your girl friend. The images are nice and you can use your good old brain to work out the windows of rain free time. I would like to convert the rain from spatial views to time slice views at my location and forward shift to work out when the rain will hit me, just so that I can time that 10 min slot to go and get some lunch.

This will involve working out the velocity of the rain band and current location to estimate the time of arrival. The loop provides 4 or more images, these can be used to estimate the direction of travel of the rain band together with wind velocities reported.

You can get individual Radar frames over Adelaide with the following format
  • URL Base: http://www.bom.gov.au/radar/IDR642.T [x.T where x is the resolution level - 2,3,4]
  • Date code: YYYYMMDD in UTC
  • Time code: HHMM in UTC 
Only last 4 frames can be directly obtained from the server. Not to worry, I am sure someone is running a cron job somewhere and backing them up. Once you have sufficient frames to establish a time series the fun part begins. Here is a Python script to fetch the last 4 frames over Adelaide, be conservative and run it every 5 minutes ( just to satisfy Nyquist) and fetch the latest frame.

The rainfall is colour coded so we will need to perform a look-up to convert from colour to rain density. Next a quick FFT based convolution for the 4 images to estimate x and y shifts. You can also use a shift and difference approach while minimizing the difference to establish the rain velocity. Statistically test the results to establish constant velocity . If the velocity is not fairly constant our prediction accuracy falls off. Then the time machine part, propagate the last image through the shift field and estimate the rain intensity at the location of interest for the next 30minutes to 1hour, whatever the horizon of the radar and rain velocity lets you do.

Obviously all this can be done much easier from within BOM since they have the data at hand, but it is much more fun mashing a separate application together.

Wednesday, August 18, 2010

MPICH2 - Joys of windows MPI

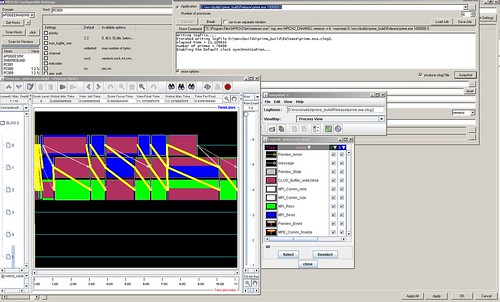
LAM/MPI is showing its age on our Ubuntu cluster. LAMD dies at times and we always seem to have more windows machines than linux pxeboot boxes. MPICH2 may allow heterogenous clusters. Here are runtimes with different communication protocols on MPICH2 and LAM with the trivial prime tutorial.
forest image
forest_image

MPICH2 : [FAQ]
sock: 4.562287
nemesis: 0.403781
ssm: 0.641682
mt: 4.793552
default: 4.489148
auto: 4.200369


LAM/MPI : [FAQ]
usysv: 0.260094
sysv: 1.899345
tcp: 1.965503
crtcp: 2.089337

The test app was built with CMake and the very handy MPI detection with MPI choice options.

On the other hand the CMake setup for polsarprosim is progressing very quickly thanks to the experience with Qgis, OTB and lots of advice from Norman and Emmanuel. Here is a what the automated testing says:

Test project C:/Program Files (x86)/PolSARpro_v4.1.5/Soft/build
 Start 1: compareOutput
1/2 Test #1: compareOutput ....................   Passed    0.07 sec
  Start 2: runSim
2/2 Test #2: runSim ...........................   Passed  3919.94 sec
100% tests passed, 0 tests failed out of 2
Total Test time (real) = 3920.05 sec


Now need to try some MPI to speed up the simulation time a bit and put the simulation run and output comparison to a standard in the proper order.

Wednesday, August 11, 2010

Writing PhD thesis and living in a hole

I have finally moved house to a crummy student digs to go with the PhD writing mood. Most of my time is spent with WinEdt and latex syntax. I might think of switching allegiance to LyX since Bibus has added Lyx support, I wonder if it will mangle my tex files into LyX specific format.

I have also been doing some TerraSAR-X quad-pol data analysis and comparing decomposition results to dual-pol case. There is a very nice overlap, but some things seem more coherent when the cross-pol scattering is not taken into account - in my case tree trunks standing on water.


I did manage to sneak in some time for open-source and check out the great work Manuel is doing to incorporate Monteverdi support into Qgis. Monteverdi can pull the layers from Qgis open files list and process them. The results currently cannot be passed directly from Monteverdi into Qgis. This issue can be solved by using a custom otbprovider which pushes Monteverdi streams into the QGis view by producing an appropriate QImage.

We have also been wondering whether an application is running inside our outside a NAT, what would be the best way to check this. Say ping an external server outside the NAT and see which source address the request came from, if the source is one particular IP (we have a static IP) then we are inside NAT and need to use internal IP's to connect to certain servers, otherwise we are outside and public IP is fine.

Friday, July 30, 2010

Getting the code out - from Academic to Open Source

I am at the IGARSS conference in Waikiki , Hawaii. It has been a busy few days. All done with my presentations today, 2 posters side-by-side are rather easy to handle. The last presentation I attended today was from Eric Pottier on PolsarPro - a very brave attempt to get academic research in polarimetric SAR processing to the non-specialist user community. He mentioned that new routines and improvements get incorporated into the platform every week, so I naturally asked about the release schedule and possible version control access. This is where the academic heritage showed up, the project in-spite of its research brilliance does not have a hard working software engineer to smooth the getting it out there process. Collation of the work from the various developers and building the final release is done manually it seems.

The folks at Rennes 1 should take a leaf out of the OTB (or even RAT) book and make collaboration easier. In the recent release the simulator that I frequently use is broken and I can't report a bug or track the changes that broke it - version control please.

PS: I created a version control for myself , only for PolSARProSim.

Monday, June 21, 2010

Ubuntu on Hawkboard and Statistics on SAR


The mind is a massively parallel device - at least at the neuron level. I am always doing multiple things simulataneously. Multiple in the sense of intellectual heritage, yet unified in a sense that I am doing something that interests me and I might as well call it an unique discipline - how to see at all parts of the spectrum or how to get to mars. In essence it is domain unified.

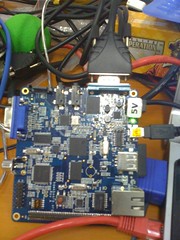
Last few days I have been looking at arm twisting the low-power DSP on the hawkboard into doing some image processing. Porting OpenCV to the DSP on beagleboard seems to be proceesing pretty well. I will have to build that and give it a try. For now I am satisfied setting up a dsplink enabled kernel and Ubuntu image from an SD card. The root image does not contain UVC drivers so I can't use my USB cameras, but at least the Hawkboard is operational. Time to switch attention to the BeagleBoard and give the dsp enabled opencv a whirl.

On the otherside I did some eigen decompositions of dual-polarimetric TerraSAR-X and PALSAR and noted how wildly different grasslands appear at L-band vs X-band. While L-band sees predominantly surface scattering, X-band is carried away by volume scattering. The X-band VV channel seems statistically most responsive to the pasture biomass, but the confidence of my statistics with only 33 sample points is rather rudimentary. The pastures are fairly dry (10% moisture) as opposed to wheat I have worked with in the past (50-60% moisture), this significantly reduces the radar cross-section and the net backscattering needs to be explained in terms of additional parameters. In this case there is significant influence from surface roughness and moisture content, backscattering increasing with increasing roughness and decreasing with increasing moisture content. Where the entropy is low I will investigate the negative-alpha filter for retrieving soil moisture.

In dual-polarimetry the alpha angle contains ambiguity and can often be misrepresented as multiple scattering. This ambiguity cannot be resolved without considering the  actual targets of interest.

Friday, June 18, 2010

Chicken and Egg - SAR Data and Field work Data

In SAR Remote Sensing you often end up with rather chicken and egg scenarios. There is the empirical application oriented school which focuses on producing parameters like biomass and soil moisture from SAR backscatter, the other school is the electromagnetic simulation school which focuses on producing estimates of SAR backscatter from parameters gathered from fieldwork. My PhD aims to reconcile these 2 schools for dual-polarimetric SAR systems in L and X band. For all practical purposes this has become ALOS-PALSAR and TerraSAR-X data analysis. Though there is some chance of using the ProSensing PLIS system in L-band.

Forest study for biomass estimation and Soil moisture at L-band is well established due to the ERS sensors - Preliminary analysis of ERS-1 SAR for forest ecosystem studies. The same applies to C-band thanks to ENVISAT, RadarSAT etc. The use of X-band for these scenarios is relatively new and I am hoping to break new ground.

The PLIS system is currently producing bright curves from corner reflectors that everybody seems to be very excited about. Other things I am not excited about is the $1000 phone bill from few hours of internet browsing in Singapore. It looks ridiculous, 2 minutes costs some $100. I could have so easily used the freewifi from - wireless@SG. Also feasible is getting a cheap local sim, things to remember before I plug my modem in.

Wednesday, June 16, 2010

Torturing Data and Helicopters - Multivariate L/X band Regression

If you torture the data long enough, it will confess - Roland Cease. I have been messing with some PALSAR and TerraSAR-X backscatter over pastures for a while now and only reasonable relationship between field data and backscatter seems to be in the soil roughness. There are lots of explanatory variables for the strength of the backscatter and 2 response variables in different polarizations in the SAR. The challenge is to relate the impact of the explanatory variables measured at the relatively few field sites to the observations in the radar.

There are some interesting instances of EM38 usage where the readings are high due to proximity to power lines and the readings are high in the SAR due to scattering from the same. These match ups have nothing to do with soil moisture but everything to do with electromagnetics.


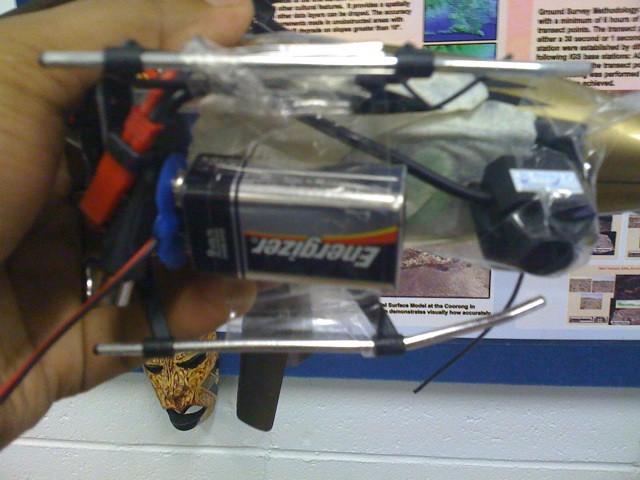
The mostly carbon fibre quadcopter has sprouted lots of aluminium extensions and will have a sizeable RCS now. Hopefully it will have sufficient power to fly. Something that definitely does not have enough power to fly is my little contra-rotor with the spy camera and 9V battery attached.

I will have to try flying the heli without the large 9v battery and just with some button cells stacked up to provide the same. Now there are rechargeable button cells from Telong making it feasible to deploy the camera with same recharge cycles as the helicopter main battery.

Friday, June 4, 2010

Coming close to beating Alzheimers - Runners up in school 3MT

We had a small 3 Minute thesis competition today for Electrical and Electronic Engineering school. We had more contenders than any other school in engineering. Either we must do the most interesting stuff around or we are the most foolhardy. The winning presentation discussed the possibility of definitive diagnosis of Alzheimer's Disease using Terahertz spectroscopy. Gretel engaged the audience and demonstrated real commitment to her research. Luke won the people's choice award and 2nd runner's up with his quickfire presentation on MIMO RADAR and how it can prevent your car from being hit by missiles while it is speeding down the runway trying to fly.

I am neither the most popular and nor the best presenter according to the judges, but I can still present at the Engineering, Computer Science and Maths heats for a spot in the University wide 3MT round. I was the 1st runner's up with my spill on the penguins. Here is the text as it was first written, what came out of my mouth at the presentation I don't know myself.

If you have seen happy feet you may think that all penguins live on ice, but this is not the case. These royal penguins live on the rocky and muddy shores of Macquarie island in the sub-antarctic which is administered by Tasmania. Apart from the penguins there are 20 to 40 scientists from Australian Antarctic Division and about 100,000 rabbits. Rabbits were introduced by the whalers in the 17th century. These rabbits eat all the vegetation on the steep slopes leaving the penguin rookeries vulnerable to landslides. The harsh terrain and harsher climate of the island makes it difficult to monitor the vegetation on foot. So the scientists turned to satellite imaging. These days everybody is familiar with satellite imagery from Google Earth, they indeed used Quickbird for a stunning image in 2007. In 2008 and 2009 however the optical sensor failed to deliver and all the images were cloudy, so the Antarctic division asked me to have a look using Synthetic Aperture Radar, TerraSAR-X. which is basically like a camera with a microwave flash which can operate at night and goes through clouds. So we had a perfect cloud free image, but like with X-ray which goes through flesh to let you see bones, the radar goes through clouds to give you a microwave view of the vegetation. Without special training people find it hard to interpret radar images. Newton said “If I have seen further it is by standing on the shoulders of giants”, I am seeing into radar by standing on shoulders on the statistics and electromagnetics giants – Gauss and Maxwell in this case. In fact on a pyramid of giants who have developed radar theory to the state it is today. My research has successfully identified the different vegetation types and the bare areas, as well as the biomass and height. The Antarctic division is planning to use this technique to track the progress of the 25 million dollar rabbit eradication program and vegetation re-establishment. My work has also been used to predict yields in various crops, such as canola and to identify cleared land in rainforests. Development of these techniques has a huge impact on how we see the vegetation covering the world.

Sunday, May 30, 2010

Messing and Meshing with FEKO

I have finally gotten around to doing some preliminary electromagnetic simulations to estimate the expected backscatter from a crop field. After looking at the PolsarPRO simulator code and being told by the author it would be pretty hard to adapt to X-band I looked at other options for producing electromagnetic simulations of crops.

One of the options is HFSS which uses finite element model based EM simulation. It can produce RCS of extended targets but will require modifications for SAR simulation. There has also been some work done using FEKO. I have already done some 2D plant model building using Python. Now it is time to send them into Blender and make something optically pretty.

There is ngPlant to draw inspiration from. Where as a lot of work has been done on image formation with standard light , I have to break new ground in easy simulated image formation with SAR.

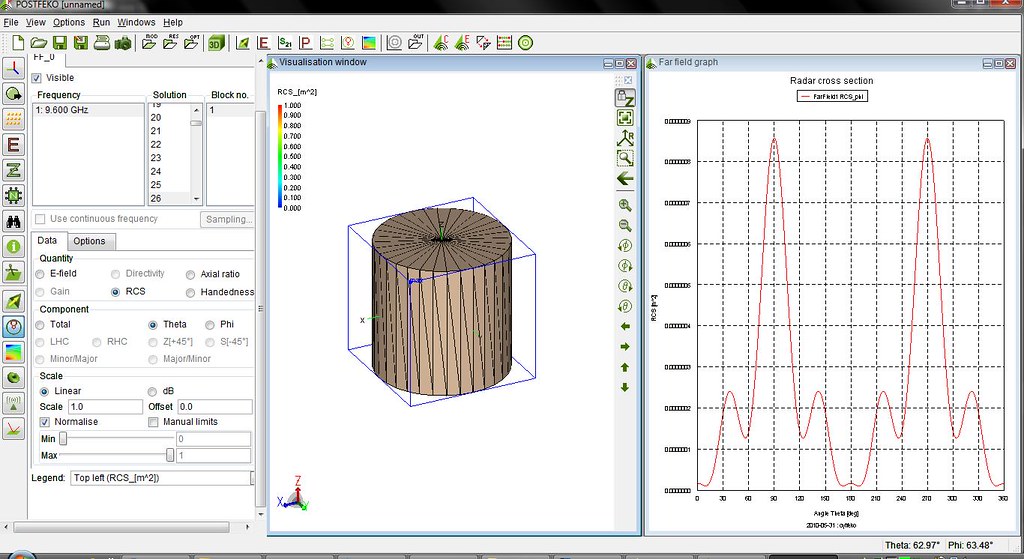
So far I have loaded a cylinder created in blender and exported to STL as a mesh into FEKO LITE, which has severe limitations on simulation size. Just as a test case the cylinder seems to have a much greater RCS in vertical compared to horizontal.

Friday, May 14, 2010

AMD vs NVIDIA and some NESTing for SAR

While nVIDIA provides backward compatible OpenCL drivers. AMD in opposition to nVIDIA who supports DirectCompute even in GeForce 8 series (8400 GT and up) for a long time ago, forgets about older than HD5000 series. I managed to get OpenCL eigenvalues kernel tested on my other machine but fell flat on my laptop with a 3670 ATI.

Some work by Orfeo Toolbox guys has recorded large performance gains in non-trivial (i.e not pixel by pixel) operations using GPU options. The eigenvalue problem is typical in SAR analysis and I would like to implement it on the GPU.

Talking about SAR, first there was BEST (Basic ESA SAR Toolbox), now ESA is funding development of NEST (Next ESA SAR Toolbox). The product so far looks impressive , Java based pulling in all the goodies including NASA WorldWind. There are plans afoot to include the DORIS InSAR processor as well.

DORIS as such is very script based and difficult to use properly. Hopefully providing and easy interface will open-up more INSAR processing options.

Sunday, May 2, 2010

Outlining in Lyx - Papers for IGARSS

My external spinning platter disk is having a fit. I will stick it in the fridge and pray that I can recover some data off it. Should not have dropped it so much and made triple copies of AGRISAR data.

Some more work I have been doing with Lyx Outline on Elance and trying to write up a paper on rangeland analysis for IGARSS with TerraSAR-X and ALOS-PALSAR. Lyx can be quite handy for writing IEEE papers from Latex templates. The outlining tools help you reorganize content and rename sections.

I have also been working on parameterizing surface roughness measured with a pin-meter into a Gaussian random generator process with exponential correlation function. More fieldwork was carried out involving driving around, photographing and collecting samples. I hope one day all this experience can be presented cohesively.